The Day I Became a Weather Guru

The Day I Became a Weather Wizard ๐ŸŒฉ๏ธ๐Ÿง™โ€โ™‚๏ธ

Want to outsmart your local weatherman with cool gadgets and tech wizardry? ๐Ÿง™โ€โ™‚๏ธ๐Ÿช„ Grab your wizard hat and staff because Iโ€™m about to show you how I set up my own weather station using a Bresser Weather Center 5-in-1, a radio receiver, and a bunch of software tools that made me feel like a tech overlord. ๐ŸŒฆ๏ธ๐Ÿ“ก๐Ÿ’ป๐Ÿ‘‘

Scope

Our grand quest includes stopping the system irrigation when it rains and managing the thermostat based on the outside temperature and room temperatures.

In the realm of home automation, only your imagination sets the boundaries.

SPOILER: Weโ€™ll achieve all this by the end of the tutorial!
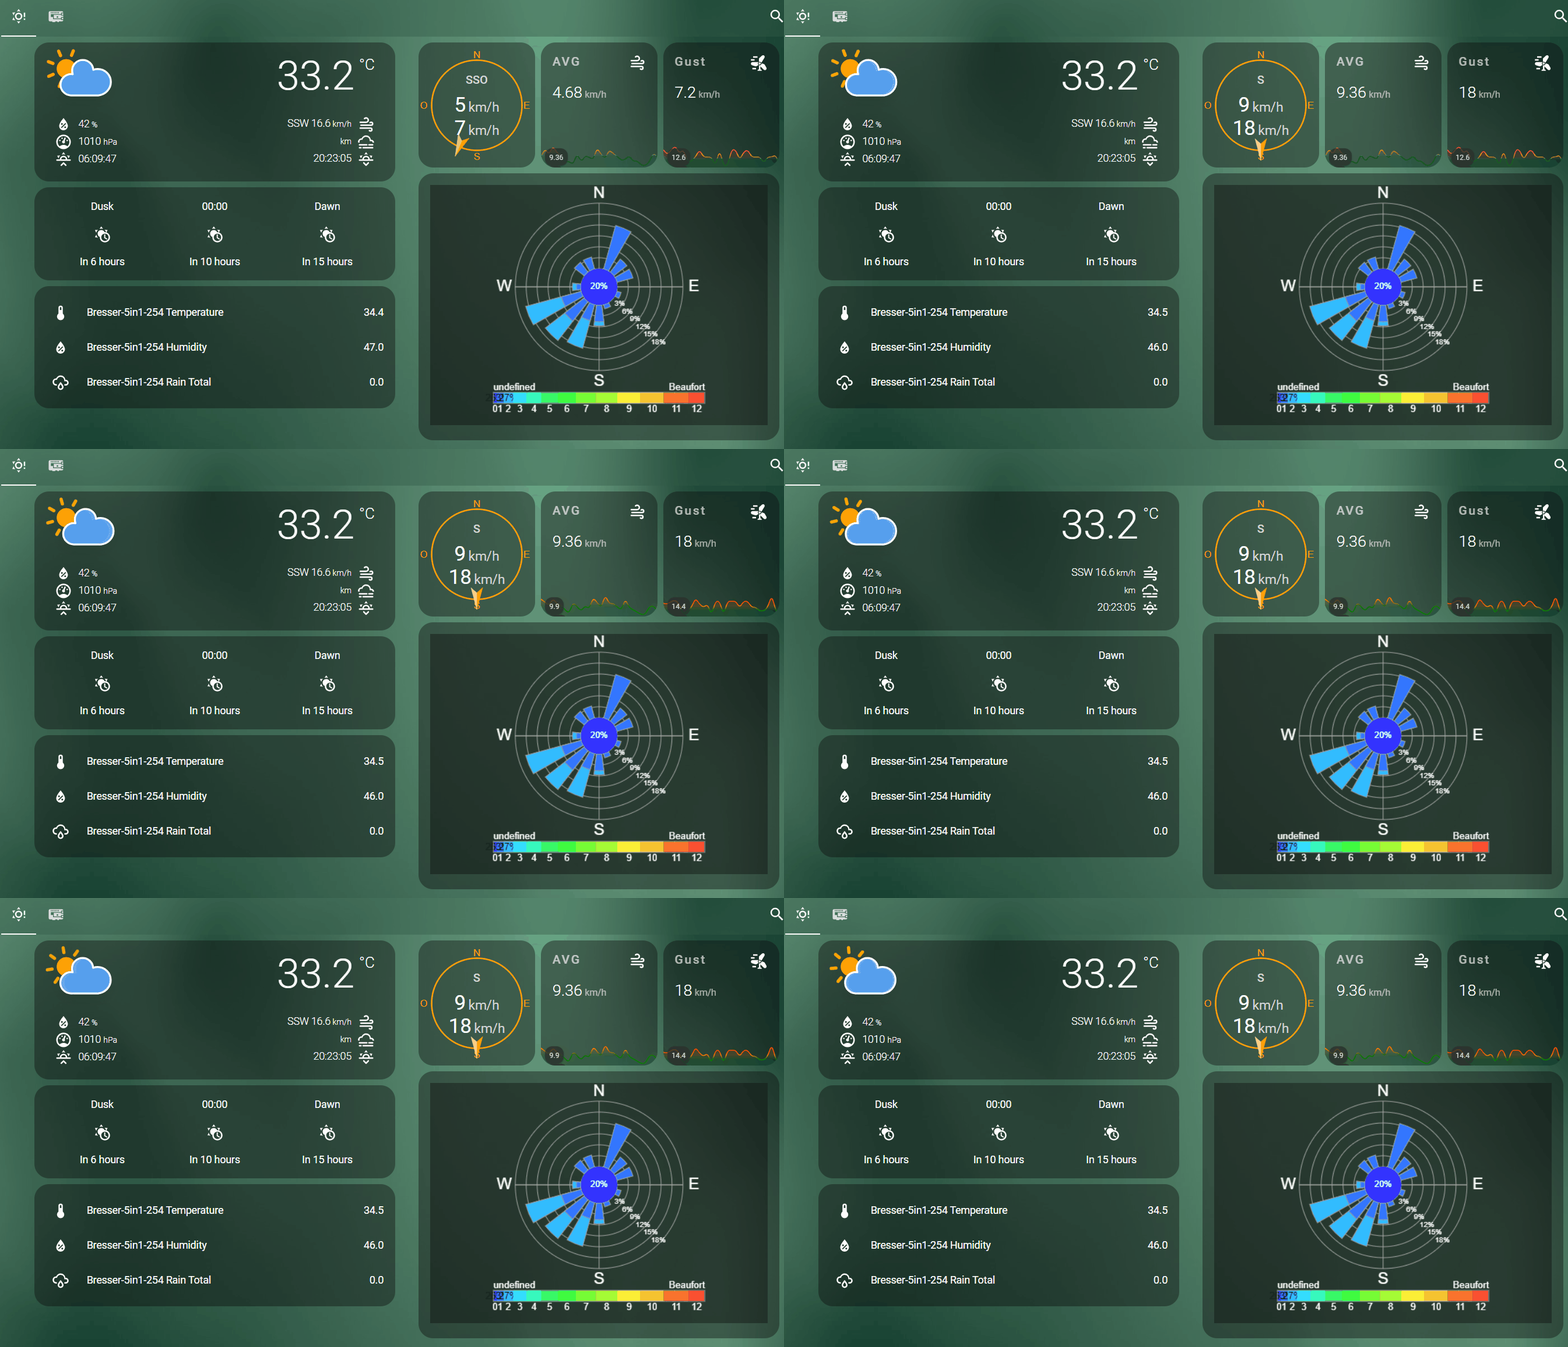
Real-time weather dashboard

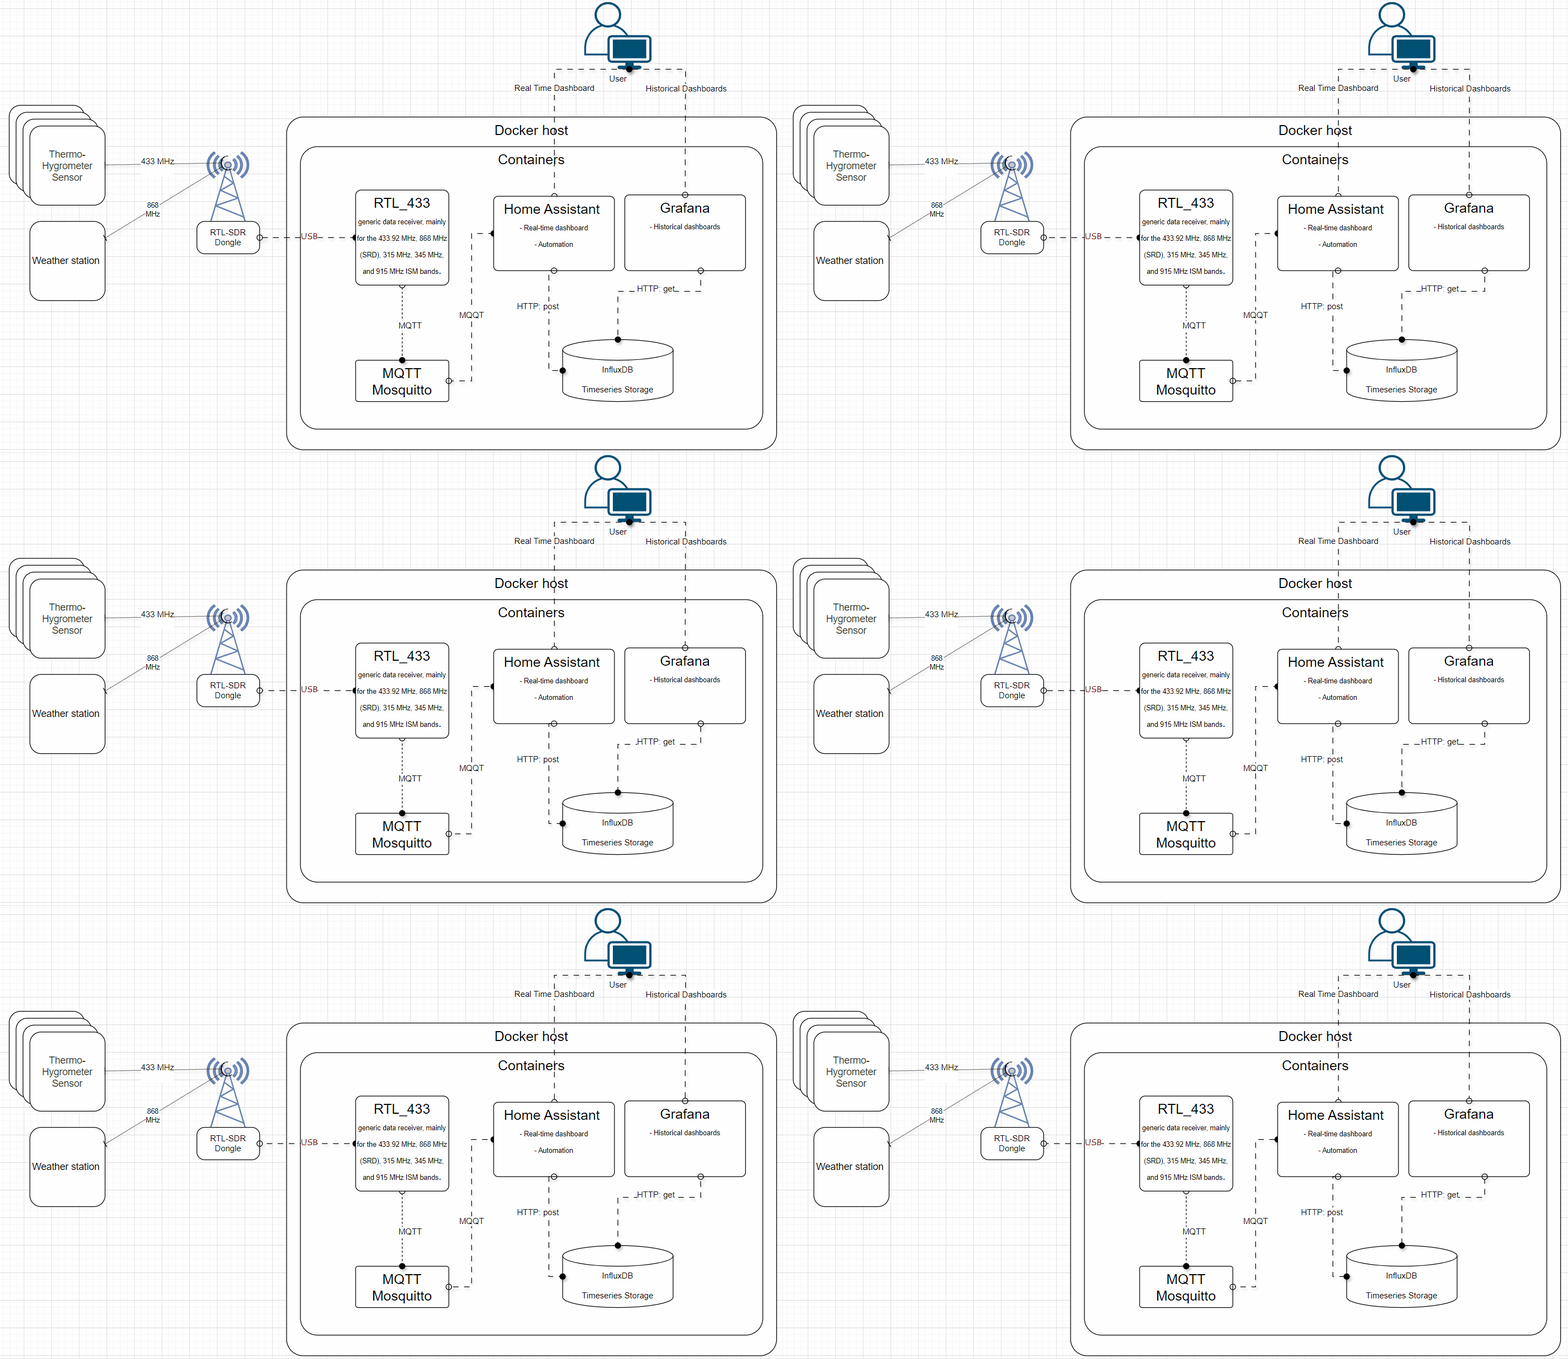
High-Level System Overview

High level system overview

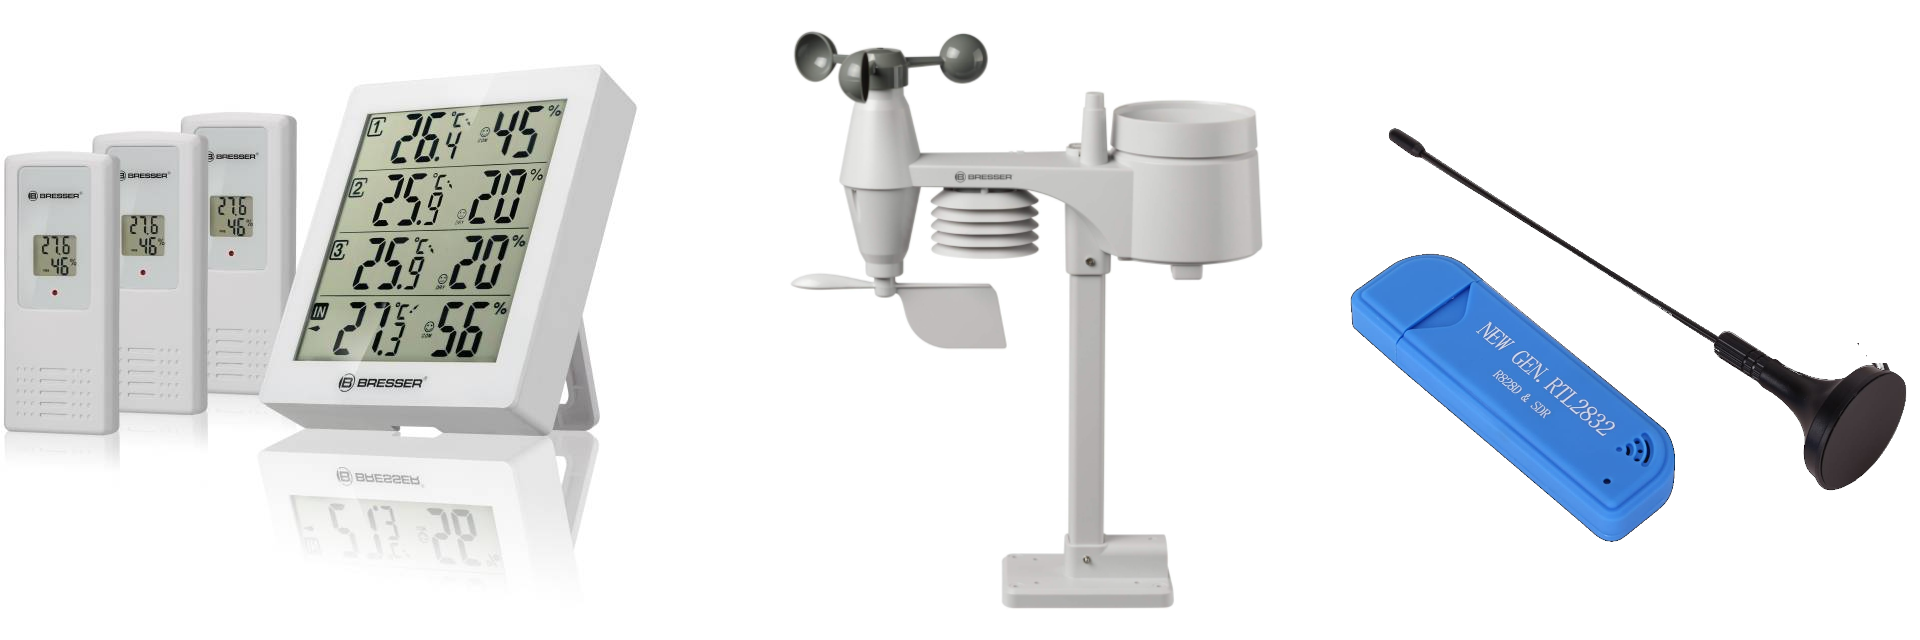
The Hardware ๐Ÿ› ๏ธ

hardware

The Weather Sensors

First up, meet the star of the show, the Bresser Weather Center 5-in-1. Itโ€™s not just a fancy name; itโ€™s a fancy gadget listed in the prestigious rtl_433 GitHub repo.

For more details, check it out here.

Room Sensors

Weโ€™re also using some room sensors to keep track of indoor temperatures and humidity: Bresser Thermo Hygrometer Quadro.

A Radio Receiver

To catch those sweet 433 MHz or 868,3 MHz signals from the weather station, I dusted off an old radio receiver.
Think of it as bringing an old friend back to the spotlight.
(And by โ€œold friend,โ€ I mean a piece of tech I had lying around from a previous project.)

Something to Run the Show

To make all this magic happen, I needed something robust to run Home Assistant, Mosquitto, InfluxDB, and Grafana. You know, the usual suspects in the smart home scene.

Setting Up the Weather Station

Mounting the weather station was like setting up a fancy birdhouse, except this one tells you when to carry an umbrella.

Once mounted, it started beaming data like a weather-obsessed R2-D2. Now, to catch those signals!

Setting Up Home Assistant

Follow this guide to get Home Assistant up and running.

Once youโ€™ve got it set up, youโ€™re halfway to becoming a weather oracle.

A Quick Dive into RTL-SDR

RTL-SDR is the superhero we need but donโ€™t deserve. Originally created for decoding HDTV signals with the RTL2832U chipset from RealTek, it now serves a higher purpose: letting us eavesdrop on RF signals. From weather stations to tire pressure sensors, if itโ€™s on 433 MHz, rtl_433 can hear it.

Docker Compose to the Rescue ๐Ÿณ

Home Assistant, Mosquitto, and PostgreSQL

Hereโ€™s the secret sauce to run Home Assistant, Mosquitto, and PostgreSQL using Docker Compose:

This section defines each service (container) that makes up the application.

Hereโ€™s an explanation of your Docker Compose file with comments:

1
2
3
4
5
6
7
8
9
10
11
12
13
14
15
16
17
18
19
20
21
22
23
24
25
26
27
28
29
30
31
32
33
34
35
36
37
38
39
40
version: '3.9'  # Specifies the version of the Docker Compose file format

services: # Defines the services (containers) that will be managed by Docker Compose
homeassistant: # Name of the service
container_name: homeassistant # Name of the container
image: "ghcr.io/home-assistant/home-assistant:2024.7.4" # Docker image and version to use for this service
volumes:
- /home/muadib/home/hass:/config # Mounts the local directory for Home Assistant configuration
- /etc/localtime:/etc/localtime:ro # Synchronizes the container's time with the host's time (read-only)
- /var/run/docker.sock:/var/run/docker.sock #for monitor docker # Allows Home Assistant to monitor Docker (requires Docker socket access)
restart: unless-stopped # Ensures the container restarts automatically unless it is explicitly stopped
network_mode: host # Shares the host's network stack (allows access to the host network directly)
depends_on: # Specifies dependencies on other services
- mosquitto # This service depends on the Mosquitto service
- postgres # This service depends on the Postgres service
- influxdb # This service depends on the InfluxDB service

postgres: # Name of the service
container_name: postgres # Name of the container
image: postgres:16.3-alpine3.20 # Docker image and version to use for this service
restart: unless-stopped # Ensures the container restarts automatically unless it is explicitly stopped
ports:
- 5432:5432 # Maps the host port 5432 to the container port 5432 (default PostgreSQL port)
volumes:
- /home/muadib/home/postgres:/var/lib/postgresql/data # Mounts the local directory for PostgreSQL data
- /etc/localtime:/etc/localtime:ro # Synchronizes the container's time with the host's time (read-only)
environment: # Environment variables for the PostgreSQL service
- POSTGRES_DB=homeassistant # Name of the default database
- POSTGRES_USER=hass # PostgreSQL user
- POSTGRES_PASSWORD=hass # PostgreSQL user's password

mosquitto: # Name of the service
container_name: mosquitto # Name of the container
image: eclipse-mosquitto:2.0.18 # Docker image and version to use for this service
ports:
- 1883:1883 #default mqtt port # Maps the host port 1883 to the container port 1883 (default MQTT port)
volumes:
- /home/muadib/home/mosquitto/mosquitto_conf:/mosquitto/config # Mounts the local directory for Mosquitto configuration
- /home/muadib/home/mosquitto/mosquitto_data:/mosquitto/data # Mounts the local directory for Mosquitto data
- /home/muadib/home/mosquitto/mosquitto_log:/mosquitto/log # Mounts the local directory for Mosquitto logs

Key Points:

  • version: Specifies the version of the Docker Compose file format.
  • services: Lists all the services to be managed by Docker Compose.
    • container_name: Sets a custom name for the container.
    • image: Defines the Docker image to use for the container.
    • volumes: Mounts directories from the host to the container for persistent storage and configuration.
    • restart: Determines the restart policy for the container.
    • network_mode: Configures the container to use the hostโ€™s network stack directly.
    • depends_on: Specifies dependencies between services to control the order of startup.
    • ports: Maps ports between the host and the container.
    • environment: Sets environment variables for the container.

This configuration sets up a multi-container environment for running Home Assistant along with supporting services like PostgreSQL (database) and Mosquitto (MQTT broker). Each service has its own container with specified configurations, dependencies, and volume mappings to ensure persistent storage and appropriate networking.

Configure Mosquitto

First, letโ€™s set up Mosquitto:

1
nano /home/muadib/home/mosquitto/mosquitto_conf/mosquitto.conf

Add the following lines:

This ini configuration file is likely for Mosquitto, an open-source MQTT (Message Queuing Telemetry Transport) broker. Each parameter controls a different aspect of the Mosquitto brokerโ€™s behavior. Hereโ€™s an explanation of each line, along with comments to describe their purpose:

1
2
3
4
5
6
7
8
9
10
11
12
13
14
15
16
17
18
19
20
21
22
23
24
25
26
persistence true  
# Enables persistent storage of messages and subscriptions.
# This means that the broker will store messages and subscriptions on disk,
# so they are not lost if the broker is restarted. persistence_location
/mosquitto/data
# Specifies the directory where the persistent data will be stored.
# In this case, the data will be stored in the /mosquitto/data directory.
log_dest file /mosquitto/log/mosquitto.log
# Sets the destination for log messages.
# 'file' means the log messages will be written to a file.
# The path /mosquitto/log/mosquitto.log is the file where the log messages will be stored.
log_type information
# Specifies the type of messages to be logged.
# 'information' indicates that informational messages will be logged.
# Other options might include debug, notice, warning, error, etc.
listener 1883
# Defines a network listener on port 1883.
# This is the default port for MQTT and is typically used for unencrypted MQTT connections.
## Authentication ##
# The following settings are related to authentication and access control.
allow_anonymous false
# Disables anonymous access.
# Clients must provide a valid username and password to connect to the broker.
password_file /mosquitto/config/mosquitto.passwd
# Specifies the file that contains the usernames and passwords for authentication.
# The file /mosquitto/config/mosquitto.passwd should contain the credentials for users allowed to connect.

Summary:

  • persistence: Enables the retention of messages and subscriptions.
  • persistence_location: Specifies the directory for storing persistent data.
  • log_dest: Defines where log messages should be sent.
  • log_type: Specifies the type of log messages.
  • listener: Configures the network port the broker listens on for incoming connections.
  • allow_anonymous: Controls whether anonymous connections are allowed.
  • password_file: Points to the file containing user authentication credentials.

These settings help configure the Mosquitto broker to store data persistently, log operational information, listen for incoming MQTT connections on the standard port, and enforce user authentication.

Create the user and set the password:

1
nano /home/muadib/home/mosquitto/mosquitto_conf/mosquitto.passwd

Enter your desired username and password in the following format:

1
username:password

Spin it up and run this command for the password file encryption:

Command 1: docker-compose up -d
1
docker-compose up -d
  • docker-compose: This is the command to interact with Docker Compose, a tool for defining and running multi-container Docker applications.
  • up: This subcommand tells Docker Compose to build, (re)create, start, and attach to containers for a service.
  • -d: This flag stands for โ€œdetached mode,โ€ meaning the containers will run in the background.

Command 2: docker-compose exec mosquitto mosquitto_passwd -U /mosquitto/config/mosquitto.passwd

1
docker-compose exec mosquitto mosquitto_passwd -U /mosquitto/config/mosquitto.passwd
  • docker-compose: Again, this is the command to interact with Docker Compose.
  • exec: This subcommand runs a command in a running service container.
  • mosquitto: The name of the service/container where the command should be executed.
  • mosquitto_passwd: This is the command within the Mosquitto container used to manage Mosquitto password files.
  • -U: This flag updates the password file, re-encrypting any plain text passwords.
  • /mosquitto/config/mosquitto.passwd: The path to the Mosquitto password file within the container.

RTL_433 Docker Compose Setup

First, identify the USB device:

1
sudo ./ports.sh

This will output something like:

1
2
3
/dev/bus/usb/001/001 - Linux_6.6.31+rpt-rpi-v8_dwc_otg_hcd_DWC_OTG_Controller_3f980000.usb 
/dev/bus/usb/001/005 - Realtek_RTL2838UHIDIR_00000001
/dev/swradio0 - Realtek_RTL2838UHIDIR_00000001

Our device is /dev/bus/usb/001/005.

Now, create the Docker Compose file for RTL_433:

1
2
3
4
5
6
7
8
9
10
11
12
13
14
15
16
17
18
19
20
21
22
23
24
25
26
27
28
29
30
31
version: '3.3' # Specifies the version of the Docker Compose file format

services:
rtl-433: # Defines a service named rtl-433
image: 'hertzg/rtl_433:23.11-alpine' # Uses the hertzg/rtl_433 image, version 23.11-alpine
hostname: rtl-433 # Sets the hostname of the container to rtl-433
container_name: rtl-433 # Names the container rtl-433
restart: unless-stopped # Automatically restarts the container unless it is explicitly stopped
network_mode: host # Uses the host's network stack
volumes: # Mounts host directories into the container
- /etc/localtime:/etc/localtime:ro # Mounts the host's localtime file as read-only
- /etc/timezone:/etc/timezone:ro # Mounts the host's timezone file as read-only
devices: # Grants the container access to the specified device
- /dev/bus/usb/001/004 # Path to the USB device on the host
command: # Specifies the command to run in the container
- '-f868300000' # Frequency to listen on: 868.3 MHz
- '-f433920000' # Frequency to listen on: 433.92 MHz
- '-H160' # Protocol number 160 to be used by rtl_433
- '-s1M' # Sample rate: 1 million samples per second
- '-Yautolevel' # Enable automatic gain adjustment
- '-Yminmax' # Display minimum and maximum signal level
- '-Ymagest' # Show magnitude estimation
- '-Mlevel' # Display signal level
- '-Mnoise' # Display noise level
- '-Mtime:unix:usec:utc' # Display time in Unix format with microseconds and UTC timezone
- '-Mbits' # Display bit-level information
- '-Mprotocol' # Display protocol information
- '-Ccustomary' # Use customary units for output
- '-Mstats:2:300' # Display statistics every 2 seconds, reset every 300 seconds
- '-Fmqtt://192.168.1.71:1883,retain=1,user=rtl,pass=rtl' # Send data to the MQTT broker at 192.168.1.71 on port 1883 with retain flag set and specified user credentials

This configuration sets up a Docker container for the rtl_433 software, which is used for receiving and decoding data from various radio transmitters, and sends the decoded data to an MQTT broker.

In my setup, I needed to scan two frequencies: one for room sensors and one for the weather station.

Fire it up:

1
docker-compose up

Youโ€™ll see:

1
2
3
4
5
6
rtl-433    | rtl_433 version 23.11 branch  at 202311281352 inputs file rtl_tcp RTL-SDR with TLS 
rtl-433 | MQTT: Publishing MQTT data to localhost port 1883
rtl-433 | Use "-F log" if you want any messages, warnings, and errors in the console.
rtl-433 | Detached kernel driver
rtl-433 | Found Rafael Micro R820T tuner
rtl-433 | Exact sample rate is: 1000000.026491 Hz rtl-433 | [R82XX] PLL not locked!

Home Assistant Add-on

Extend the Docker Compose for RTL with this:

1
2
3
4
5
6
7
8
9
10
11
12
13
14
15
16
  rtl_433_autodiscovery:
profiles:
- donotstart
container_name: rtl_433_autodiscovery
image: ghcr.io/pbkhrv/rtl_433-hass-addons-rtl_433_mqtt_autodiscovery-aarch64:next # On Raspberry Pi replace `amd64` with the appropriate architecture.
environment:
- MQTT_HOST=192.168.1.71
- MQTT_USERNAME=rtl
- MQTT_PASSWORD=rtl
- MQTT_PORT=1883
# - RTL_TOPIC=rtl_433/rtl-433/events
# - DISCOVERY_PREFIX=homeassistant
# - DISCOVERY_INTERVAL=30
# - LOG_LEVEL=debug
- OTHER_ARGS=--retain

This service is required for the Home Assistant discovery feature. Use it on demand when you need to add a new device; otherwise, leave it stopped.

Now, letโ€™s restart and check the Home Assistant devices list. You should see the weather station and the room sensors available.

๐ŸŒŸ Enabling MQTT Integration ๐ŸŒŸ

Almost there! ๐ŸŒˆ Just one last thing: turn on the MQTT integration in Home Assistant. ๐Ÿš€ Zoom over to the integrations page, add MQTT, and watch as your weather stationโ€™s data flows in like a boss! ๐Ÿ˜Ž๐Ÿ“ˆ

And voilร ! ๐ŸŽ‰ Youโ€™ve leveled up to weather guru status, all while chuckling at the old tech youโ€™ve repurposed. Now, go forth and predict the weather like a pro (or at least dazzle your neighbors)! ๐Ÿง™โ€โ™‚๏ธ๐ŸŒฆ๏ธ


๐Ÿ› ๏ธ Create Your Home Assistant Dashboard ๐Ÿ› ๏ธ

Add a dashboard in Home Assistant to display all the juicy data from your weather station and the sensors in each room. ๐Ÿ ๐ŸŒก๏ธ๐Ÿ’ง

Weather dashboard


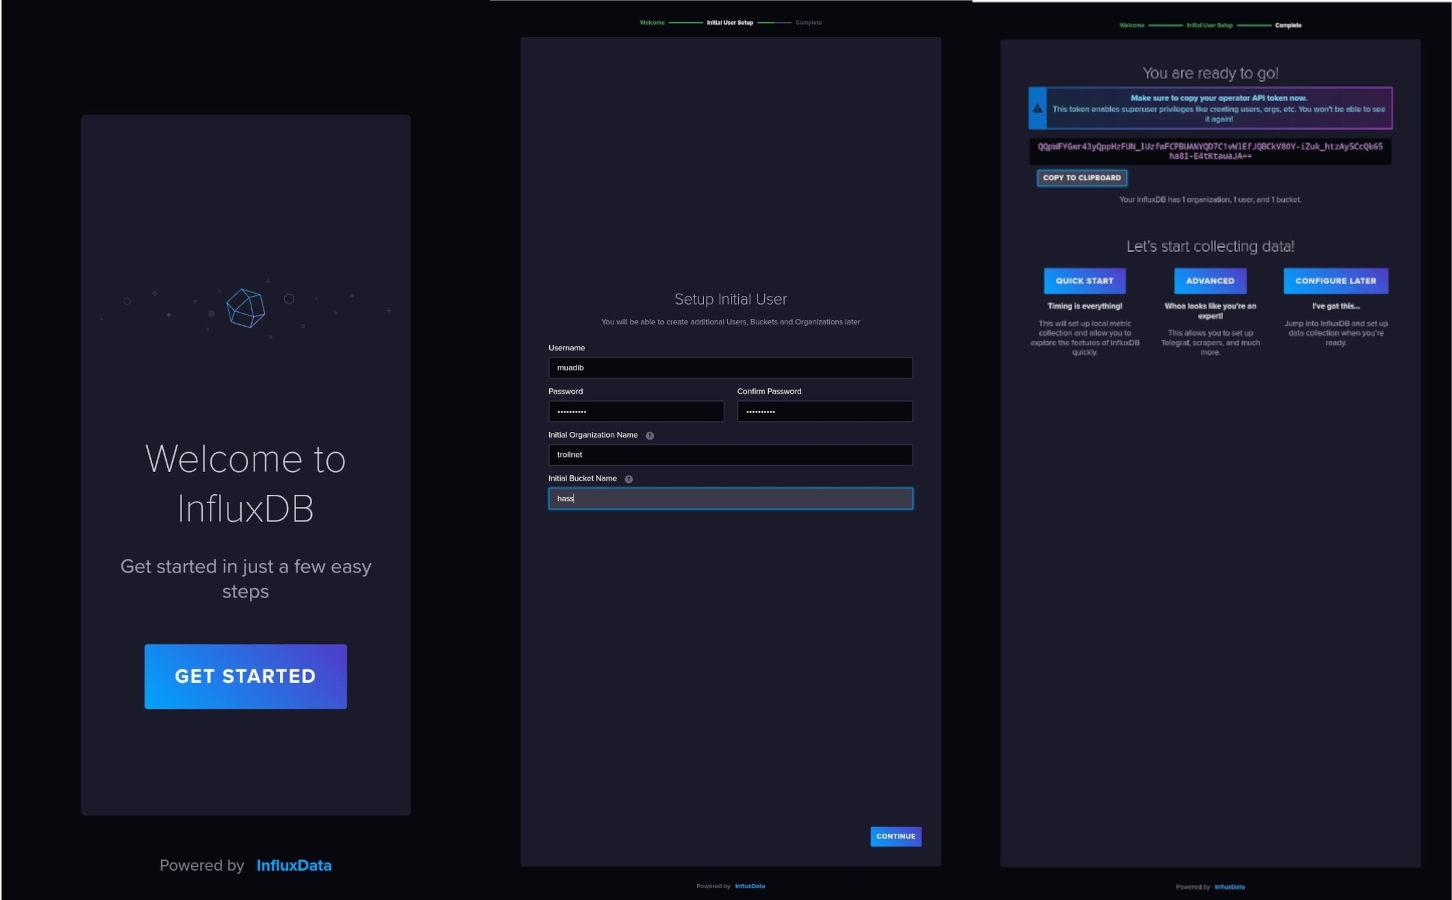
๐ŸŒ€ InfluxDB 2 Configuration ๐ŸŒ€

Configure InfluxDB with your user, organization, and bucket. Follow the steps in the images below:
influxdb

Set up your InfluxDB user and organization name, and configure your bucket:

![influxdb - configuration](/2024/08/08/The-Day-I-Became-a-Weather-Wizard/Pasted image 20240805223114.png โ€œinfluxdb - configurationโ€)

Next, configure Home Assistant:

1
muadib@zigbee:~ $ sudo nano home/hass/configuration.yaml
1
2
3
4
5
6
7
8
9
10
11
12
13
14
15
16
17
18
19
20
21
22
23
influxdb:
api_version: 2 # Specifies the API version used to communicate with InfluxDB.
ssl: false # Determines if SSL (secure connection) is used. 'false' means no SSL.
host: localhost # The hostname or IP address of the InfluxDB server.
port: 8086 # The port number on which InfluxDB is running.
token: !secret influxdb_token # Authentication token for accessing InfluxDB, stored securely.
organization: trollnet # The name of the organization in InfluxDB.
bucket: hass # The name of the bucket (database) to store data in InfluxDB.
tags:
source: ha # Adds a tag named 'source' with the value 'ha' to all data points.
tags_attributes:
- friendly_name # Includes the attribute 'friendly_name' as a tag in data points.
default_measurement: units # Sets a default measurement name for data points when not specified.
include:
domains:
- person # Specifies to include data from entities in the 'person' domain.
entity_globs:
- sensor.speedtest* # Includes entities that match the pattern 'sensor.speedtest*'.
- sensor.ram_use_pct* # Includes entities that match the pattern 'sensor.ram_use_pct*'.
- sensor.cpu_load* # Includes entities that match the pattern 'sensor.cpu_load*'.
- sensor.bresser* # Includes entities that match the pattern 'sensor.bresser*'.
- sensor.nexus* # Includes entities that match the pattern 'sensor.nexus*'.

restart home-assistant.

๐Ÿ“Š Grafana Setup ๐Ÿ“Š

Bind Mounts (Optional) ๐Ÿš€

If youโ€™re using directories on your host for Grafanaโ€™s database or configuration, start the container with a user who has permission to access and write to the directory you map. ๐Ÿ› ๏ธ

Find a userโ€™s UID or GID in Unix:

1
2
muadib@zigbee:~ $ id -u muadib
1000

Create an .env file:

1
UID=1000

Ensure the volume mount folder exists and is owned by the desired user/group:

1
muadib@zigbee:~/hass-docker $ mkdir ../home/grafana

Configure Grafana and InfluxDB in docker-compose.yml:

1
2
3
4
5
6
7
8
9
10
11
12
13
14
15
16
17
18
19
20
21
22
23
grafana:
image: grafana/grafana:11.1.1
container_name: grafana
restart: always
user: ${UID}
ports:
- 3000:3000
depends_on:
- influxdb
volumes:
- "/home/muadib/home/grafana:/var/lib/grafana"
env_file:
- path: ./.env
required: true
influxdb:
image: influxdb:2.7.8-alpine
container_name: influxdb
restart: always
ports:
- 8086:8086
- 8089:8089/udp
volumes:
- "/home/muadib/home/influxdb:/var/lib/influxdb2"

Check the logs and restart a single container from the Docker Compose setup:

1
2
3
4
5
docker-compose stop -t 1 grafana
docker-compose build grafana
docker-compose up --no-start grafana
docker-compose start grafana
docker-compose logs -f grafana

๐ŸŒ Add InfluxDB to Grafana ๐ŸŒ

Configure InfluxDB as a data source in Grafana:

  1. Open your web browser and go to Grafanaโ€™s root URL, usually http://localhost:3000. ๐ŸŒ
  2. On the sign-in page, use admin for both username and password.
  3. Click Sign in and change your password when prompted. ๐Ÿ”’
  4. Go to the data source section and find InfluxDB. ๐ŸŒŸ

Generate a new API token in InfluxDB for Grafana:

![influxdb - configuration](/2024/08/08/The-Day-I-Became-a-Weather-Wizard/Pasted image 20240803214228.png โ€œinfluxdb - configurationโ€)


๐Ÿ“ˆ Install the Wind Rose Plugin ๐Ÿ“ˆ

  1. Clone the plugin repository:
    git clone https://github.com/spectraphilic/grafana-windrose.git
  2. Stop the Grafana-Docker container.
  3. Manually copy the plugin to /var/lib/grafana/plugins/grafana-windrose.
  4. Restart the Grafana-Docker container and check the plugin settings. ๐ŸŽจ

Install ECharts for advanced visualizations:

1
install https://github.com/apache/echarts

๐ŸŽจ Crafting the Dashboard ๐ŸŽจ

Create your dashboard and visualize the data:

![grafana dashboard](/2024/08/08/The-Day-I-Became-a-Weather-Wizard/Pasted image 20240805225325.png โ€œgrafana dashboardโ€)

Set up a Grafana variable period as shown above:

1
2
3
4
5
environment:
- GF_INSTALL_PLUGINS=volkovlabs-echarts-panel # Specifies a Grafana plugin to install (echarts panel by Volkov Labs)
- GF_DEFAULT_APP_MODE=development # Sets the Grafana application mode to development for easier debugging
- GF_PLUGINS_ALLOW_LOADING_UNSIGNED_PLUGINS=grafana-windrose # Allows loading an unsigned plugin (windrose plugin for Grafana)

Design your dashboard like this:

![grafana dashboard ](/2024/08/08/The-Day-I-Became-a-Weather-Wizard/Pasted image 20240807200447.png โ€œgrafana dashboardโ€)


๐ŸŒฌ๏ธ Wind and Speed Direction Chart ๐ŸŒฌ๏ธ

Create the Flux query for wind speed and direction:

1
2
3
4
5
6
7
8
9
10
11
12
13
14
15
16
17
18
19
20
21
22
23
24
25
26
27
28
29
30
31
32
33
34
35
36
speed = from(bucket: "hass")

|> range(start: v.timeRangeStart, stop: v.timeRangeStop)

|> filter(fn: (r) => r["entity_id"] == "bresser_5in1_254_wind_average")

|> filter(fn: (r) => r["_field"] == "value")

|> aggregateWindow(every: ${period}, fn: mean, createEmpty: false)

|> pivot(rowKey:["_time"], columnKey: ["entity_id"], valueColumn: "_value")

|> rename(columns: {"bresser_5in1_254_wind_average": "speed", "_measurement": "unit"})

|> keep(columns: ["_time", "speed", "unit"])

direction = from(bucket: "hass")

|> range(start: v.timeRangeStart, stop: v.timeRangeStop)

|> filter(fn: (r) => r["entity_id"] == "bresser_5in1_254_wind_direction")

|> filter(fn: (r) => r["_field"] == "value")

|> aggregateWindow(every: ${period}, fn: mean, createEmpty: false)

|> pivot(rowKey:["_time"], columnKey: ["entity_id"], valueColumn: "_value")

|> rename(columns: {"bresser_5in1_254_wind_direction": "direction", "_measurement": "unit"})

|> keep(columns: ["_time", "direction", "unit"])

join(
tables: {speed, direction},
on: ["_time"]
)

Create your business dashboard, use the code option for creating a dashboard:

1
2
3
4
5
6
7
8
9
10
11
12
13
14
15
16
17
18
19
20
21
22
23
24
25
26
27
28
29
30
31
32
33
34
35
36
37
38
39
40
41
42
43
44
45
46
let wind;

context.panel.data.series.map((s) => {

const time = s.fields.find((f) => f.name === '_time').values;

const value = s.fields.find((f) => f.name === 'speed').values;

const rotate = s.fields.find((f) => f.name === 'direction').values;

wind = time.map((id, index) => {
return { symbolRotate: rotate[index], value: [time[index], value[index]] };
});

});

return {
xAxis: {
type: 'time'
},
yAxis: {
type: 'value'
},
visualMap: {
orient: 'horizontal',
left: 'center',
min: 0,
max: 10,
text: ['High', 'Low'],
dimension: 1,
inRange: {
color: ['#65B581', '#FFCE34', '#FD665F']
}
},
series: [
{
data: wind,
type: 'line',
symbol: 'path://M31 24.7343L21.7917 24.7343V0L9.20826 0L9.20826 24.7343H0L15.5 45L31 24.7343Z',
symbolSize: 20,
lineStyle: {
width: 0.3
}
}
]
};

๐ŸŒช๏ธ Windrose Visualization ๐ŸŒช๏ธ

Create two queries: one for wind speed and one for wind direction.

Speed Query:

1
2
3
4
5
6
7
8
9
10
11
12
13
14
15
from(bucket: "hass")

|> range(start: v.timeRangeStart, stop: v.timeRangeStop)

|> filter(fn: (r) => r["entity_id"] == "bresser_5in1_254_wind_average")

|> filter(fn: (r) => r["_field"] == "value")

|> aggregateWindow(every: ${period}, fn: mean, createEmpty: false)

|> pivot(rowKey:["_time"], columnKey: ["entity_id"], valueColumn: "_value")

|> rename(columns: {"bresser_5in1_254_wind_average": "speed", "_measurement": "unit"})

|> keep(columns: ["_time", "speed", "unit"])

Direction Query:

1
2
3
4
5
6
7
8
9
10
11
12
13
14
15
16
17
from(bucket: "hass")

|> range(start: v.timeRangeStart, stop: v.timeRangeStop)

|> filter(fn: (r) => r["entity_id"] == "bresser_

5in1_254_wind_direction")

|> filter(fn: (r) => r["_field"] == "value")

|> aggregateWindow(every: ${period}, fn: mean, createEmpty: false)

|> pivot(rowKey:["_time"], columnKey: ["entity_id"], valueColumn: "_value")

|> rename(columns: {"bresser_5in1_254_wind_direction": "direction", "_measurement": "unit"})

|> keep(columns: ["_time", "direction", "unit"])

Select the windrose chart type:

![grafana dashboard -windrose ](/2024/08/08/The-Day-I-Became-a-Weather-Wizard/Pasted image 20240807201501.png โ€œgrafana dashboard -windroseโ€)


๐Ÿ† Conclusion ๐Ÿ†

Armed with your Bresser Weather Center 5-in-1, a vintage radio receiver, and a sprinkle of software magic, youโ€™ve created a setup that reads, interprets, and displays weather data like a true wizard. ๐ŸŒŸ

Seeing real-time weather updates and having your home respond automatically is nothing short of thrilling. ๐ŸŒฆ๏ธ So, if youโ€™re up for some weather wizardry, remember: with the right tools and a dash of patience, you too can conjure up some magic. โœจ

Happy weather-watching! ๐ŸŒˆ๐Ÿ”ฎ